机器配置信息
Architecture:                    x86_64
CPU op-mode(s):                  32-bit, 64-bit
Byte Order:                      Little Endian
Address sizes:                   39 bits physical, 48 bits virtual
CPU(s):                          16
On-line CPU(s) list:             0-15
Thread(s) per core:              2
Core(s) per socket:              8
Socket(s):                       1
NUMA node(s):                    1
Vendor ID:                       GenuineIntel
CPU family:                      6
Model:                           165
Model name:                      Intel(R) Core(TM) i7-10700 CPU @ 2.90GHz
Stepping:                        5
Frequency boost:                 enabled
CPU MHz:                         2953.213
CPU max MHz:                     2901.0000
CPU min MHz:                     800.0000
BogoMIPS:                        5799.77
Virtualization:                  VT-x
L1d cache:                       256 KiB
L1i cache:                       256 KiB
L2 cache:                        2 MiB
L3 cache:                        16 MiB
NUMA node0 CPU(s):               0-15
Vulnerability Itlb multihit:     KVM: Mitigation: Split huge pages


RANGE                                  SIZE  STATE REMOVABLE  BLOCK
0x0000000000000000-0x000000009fffffff  2.5G online       yes   0-19
0x0000000100000000-0x000000045fffffff 13.5G online       yes 32-139


Memory block size:       128M
Total online memory:      16G
Total offline memory:      0B


sda           8:0    0 931.5G  0 disk
├─sda1        8:1    0   500G  0 part
└─sda4        8:4    0   100G  0 part /home/jian/sda
nvme0n1     259:0    0 238.5G  0 disk
├─nvme0n1p1 259:1    0   476M  0 part /boot/efi
├─nvme0n1p2 259:2    0   977M  0 part
├─nvme0n1p3 259:3    0   1.9G  0 part
└─nvme0n1p4 259:4    0 235.2G  0 part /
Perl脚本分析
Run文件是用perl脚本编写的自动化测试文件,入口在main函数:
sub main {
    # 将参数列表保存到args数组中
    my @args = @_;
    # 解析参数,支持-q 精简模式,-v verbose详尽模式,-i 测试次数,-c 并行数
    # 从建立的所有测试项目的Hash List中查找该项目,或者是all全部
    my $params = parseArgs(@args);
    my $verbose = $params->{'verbose'} || 1;
    # 如果增加了-i参数计算并行数
    if ($params->{'iterations'}) {
        $longIterCount = $params->{'iterations'};
        $shortIterCount = int(($params->{'iterations'} + 1) / 3);
        $shortIterCount = 1 if ($shortIterCount < 1);
    }


    # 没有相应的项目, 则执行"index"中的项目
    my $tests = $params->{'tests'};
    if ($#$tests < 0) {
        $tests = $index;
    }


    # 创建results目录保存测试结果,tmp目录为临时测试目录
    my @creatingDirectories = ( ${TMPDIR}, ${RESULTDIR} );
    createDirrectoriesIfNotExists(@creatingDirectories);
    # 提前检查,检查是否有测试程序,没有则重新编译
    preChecks();
    my $systemInfo = getSystemInfo();


    # 如果没有用-i指定并发数则默认指定1和num of cpus
    my $copies = $params->{'copies'};
    if (!$copies || scalar(@$copies) == 0) {
        push(@$copies, 1);
        if (defined($systemInfo->{'numCpus'}) && $systemInfo->{'numCpus'} > 1) {
            push(@$copies, $systemInfo->{'numCpus'});
        }
    }


    # 显示logo
    system("cat \"${BINDIR}/unixbench.logo\"");


    # 显示tmp和results目录
    if ($verbose > 0) {
        printUsingDirectories();
    }
    # 如果是详尽模式则将信息输出到终端
    if ($verbose > 1) {
        printf "\n", join(", ", @$tests);
        printf "Tests to run: %s\n", join(", ", @$tests);
    }


    # 生成 report 和 log file.
    my $reportFile = logFile($systemInfo);
    my $reportHtml = $reportFile . ".html";
    my $reportCsv = $reportFile . ".csv";
    my $logFile = $reportFile . ".log";


    # 如果定义了"UB_OUTPUT_CSV", 输出 csv file.
    my $ubOutputCsv = $ENV{"UB_OUTPUT_CSV"};
    my $isOutputFormatCsv = defined($ubOutputCsv) && $ubOutputCsv eq "true";
    # 写CSV header
    my $is_csv_header_written = 0;

    # 打开log files并写入
    open(my $reportFd, ">", $reportFile) ||
                            die("Run: can't write to $reportFile\n");
    open(my $reportFd2, ">", $reportHtml) ||
                            die("Run: can't write to $reportHtml\n");
    my $reportFd_Csv;
    if ($isOutputFormatCsv) {
        open($reportFd_Csv, ">", $reportCsv) ||
                            die("Run: can't write to $reportCsv\n");
    }


    printf $reportFd "   BYTE UNIX Benchmarks (Version %s)\n\n", $version;
    runHeaderHtml($systemInfo, $reportFd2);


    # 转储系统信息
    displaySystem($systemInfo, $reportFd);
    displaySystemHtml($systemInfo, $reportFd2);


    # Run the tests!  Do a test run once for each desired number of copies;
    # for example, on a 2-CPU system, we may do a single-processing run
    # followed by a dual-processing run.
    # 运行,多并发数存储在copies中
    foreach my $c (@$copies) {
        if ($verbose > 1) {
            printf "Run with %s\n", number($c, "copy", "copies");
        }
        # 运行并计算结果
        my $results = runTests($tests, $verbose, $logFile, $c);


        summarizeRun($systemInfo, $results, $verbose, $reportFd);
        summarizeRunHtml($systemInfo, $results, $verbose, $reportFd2);


        if ($isOutputFormatCsv) {
            if ( $is_csv_header_written == 0 ) {
                summarizeRunCsvHeader($results, $reportFd_Csv);
                $is_csv_header_written = 1;
            }
            summarizeRunCsvRows($results, $reportFd_Csv);
        }
    }


    runFooterHtml($reportFd2);


    # 结束测试
    close($reportFd);
    close($reportFd2);
    if ($isOutputFormatCsv) {
        close($reportFd_Csv);
    }


    # 如果不是quiet模式则输出reportFile文件中的内容
    if ($verbose > 0) {
        printf "\n";
        printf  "========================================================================\n";
        system("cat \"$reportFile\"");
    }
    0;
}
一个最重要的问题就是脚本是怎么计算性能分数的?
首先在执行二进制文件时会将time、count、elap三个参数传给二进制文件,分别是需要执行的时间、执行的次数、实际执行的时间,例如execl中:默认time为30,count为0,elap为0,当二进制文件执行完之后去改写count和elap,脚本拿到count和elap计算出平均的INDEX值,从而反映性能好坏。具体的计算方法为根据执行的次数加和所有CPU的count值,去掉一次最低值,用剩下的count总和/次数求出平均count值,再计算平均时间,相除算出RESULT,RESULT除以(BASELINE/10)得出INDEX。
最后一个问题,为什么写的这么复杂?
我觉得主要是业务的复杂性决定的,数据的索引关系并不复杂,主要是在顶层建立一个testList用于索引所有的测试项目,根据具体的测试项目名去testParams中找到对应的参数,用于执行。其次可能是采用的测试框架所决定的,如果没有的话我觉得测试框架还是很有必要的,纯属个人理解,待考量。
测试代码分析
execl
execl参数为
"options" => "30"
execl测试全部集中在execl.c文件中,主要过程为
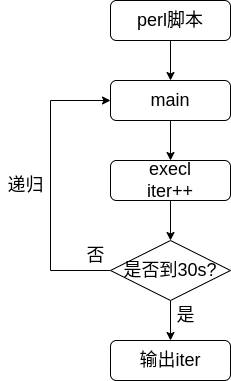
测试主要是通过递归的调用execl系统调用,通过一段时间内执行的次数来反映好坏
int main(argc, argv)
{
    //获取测试时间
	duration = atoi(argv[1]);
	if (duration > 0)
	/* the first invocation */
	{
		dur_str = argv[1];
		if((ptr = getenv("UB_BINDIR")) != NULL)
			sprintf(path_str,"%s/execl",ptr);
		fullpath=path_str;
        /* 获取时间戳作为启动时间 */
		time(&start_time);
	}
	else  /* one of those execl'd invocations */
	{
		/* 第二次开始之后参数为
         * /x/execl 0 dur_str count_str start_str
         * /x/execl 0 30 1 xxx
         * 获取时间限制30s
         */
		duration = atoi(argv[2]);
		dur_str = argv[2];
        /* 执行次数iter */
		iter = (unsigned long)atoi(argv[3]); /* where are we now ? */
		sscanf(argv[4], "%lu", (unsigned long *) &start_time);
		fullpath = argv[0];
	}
    /* 执行次数+1,最后iter作为最终的count值 */
	sprintf(count_str, "%lu", ++iter); /* increment the execl counter */
	sprintf(start_str, "%lu", (unsigned long) start_time);
	/* 获取时间戳作为执行后的时间,用于判断是否应该结束执行并返回 */
    time(&this_time);
    /* 超时则结束执行,duration设置为30s */
	if (this_time - start_time >= duration) {
		fprintf(stderr, "COUNT|%lu|1|lps\n", iter);
		exit(0);
	}
    /* 递归执行execl系统调用 */
	execl(fullpath, fullpath, "0", dur_str, count_str, start_str, (void *) 0);
	fprintf(stderr, "Exec failed at iteration %lu\n", iter);
	perror("Reason");
	exit(1);
}
FileCopy1024-bufsize2000-maxblocks
fstime参数为
"options" => "-c -t 30 -d \"${TMPDIR}\" -b 1024 -m 2000"
file copy三项测试文件全部集中在fstime.c文件中,其实还有file read、file write测试也都是由这个文件完成,主要是根据传入参数的不同执行不同的测试,虽然fstime实现了三种测试,但在UnixBench中只有file copy作为测试的benchmark
int main(argc, argv)
{
    //根据-c -r -w执行copy、read、write测试
    for (i = 1; i < argc; ++i) {
        if (argv[i][0] == '-') {
            switch (argv[i][1]) {
                case 'b':
                    //buffer size,这里为1024
                    bufsize = atoi(argv[++i]);
                    break;
                case 'm':
                    //最大block数,这里为2000
                    max_blocks = atoi(argv[++i]);
                    break;
                case 't':
                    //指定执行时间,没有指定则为10
                    seconds = atoi(argv[++i]);
                    break;
            }
    }
    /*
     * buffer数量,max_blocks通过-m参数传递进来,bufsize通过-b传递进来
     * max_buffs为最终的buffer数量,bufsize则为每次写入或读取的size大小
     */
    max_buffs = max_blocks * 1024 / bufsize;
    count_per_k = 1024 / COUNTSIZE;
    count_per_buf = bufsize / COUNTSIZE;


    /* 初始化buffer,buf最大为8192,每次只会用到bufsize */
    for (i=0; i < bufsize; ++i)
            buf[i] = i & 0xff;
    /* 清理函数 */
    signal(SIGKILL,clean_up);


    switch (test) {
    case 'c':
        w_test(2);
        r_test(2);
        status = c_test(seconds);
        break;
    }
}
主要的测试函数为c_test,而在file copy测试中会先调用write和read测试各2s进行数据的填充,中间还有2次2s的睡眠,一共12s,所以file copy实际执行的时间只有36s左右,在copy测试执行前还有3s的时间sleep,所以实际执行时间只有33s,copy测试时间预设30s,通过alarm系统调用设定指定时间并绑定函数,到达预定时间后会产生alarm信号并执行绑定的函数,w_test、r_test测试过程都类似,都是通过指定测试时间,通过在测试文件中以bufsize大小进行read或write,计算执行的一个分数,每执行一次read或write,则counted加bufsize/COUNTSIZE
int c_test(int timeSecs)
{
        /* 开始时间 */
        start = getFloatTime();
        while (!sigalarm) {
                if ((tmp=read(f, buf, bufsize)) != bufsize) {
                    ...
                } else  {
                        if ((tmp=write(g, buf, bufsize)) != bufsize) {
                                counted += (
                                 /* Full credit for part of buffer written */
                                        tmp +
                                 /* Plus part credit having read full buffer */
                                        ( ((bufsize - tmp) * write_score) /
                                        (read_score + write_score) )
                                        + HALFCOUNT) / COUNTSIZE;
                                stop_count();
                        } else
                                counted += count_per_buf;
                }
        }
        /* 结束时间 */
        end = getFloatTime();
        copy_score = (long) ((double) counted / ((end - start) * count_per_k));
        return(0);
}
file copy测试会打开已经写入的文件句柄f,之前执行的read和write都是在这个文件中,file copy测试会从f中进行读取,而写入到文件句柄g中,完成一次完整的读写才会计算分值,最后一次不足bufsize的copy根据写入大小进行计算,最后得到copy_score,根据file copy的分数计算公式,score正比于n(单位时间内执行的次数),也就是说在30s内n越大则copy_score越大,而n与counted呈正比关系,所以单位时间内read、write执行的越快则分数越高
FileCopy256-bufsize500-maxblocks
file copy256 bufsize500测试与上面的过程没有区别,只是传递的参数有变化,max_blocks为256,bufsize为500
FileCopy4096-bufsize8000-maxblocks
同理,max_blocks为4096,bufsize为8000
Process-Creation
spawn的参数为
"options" => "30"
执行过程很简单,通过while(1)死循环不停的从当前进程中创建子进程,创建成功iter加1,到达指定时间后调用report函数退出执行,duration指定为30s
int main(argc, argv)
int	argc;
char	*argv[];
{
    /* 统计最终执行的次数 */
	iter = 0;
    /* 指定时间后唤醒执行report函数 */
	wake_me(duration, report);


	while (1) {
		if ((slave = fork()) == 0) {
			/* kill it right away */
			exit(0);
		} else if (slave < 0) {
			/* woops ... */
		} else
			/* master */
			wait(&status);
		iter++;
	}
}
内核代码分析
execl
perf stat
perf stat计算总体执行时间
One CPU
Benchmark Run: 四 12月 23 2021 14:50:17 - 14:50:50
16 CPUs in system; running 1 parallel copy of tests


Execl Throughput                               6304.3 lps   (29.3 s, 1 samples)


System Benchmarks Partial Index              BASELINE       RESULT    INDEX
Execl Throughput                                 43.0       6304.3   1466.1
                                                                   ========
System Benchmarks Index Score (Partial Only)                         1466.1


 Performance counter stats for './Run execl -c 1 -i 1':


         28,637.60 msec task-clock                #    0.882 CPUs utilized
             3,947      context-switches          #    0.138 K/sec
               384      cpu-migrations            #    0.013 K/sec
         9,975,197      page-faults               #    0.348 M/sec
   124,665,734,479      cycles                    #    4.353 GHz                      (30.82%)
   144,405,043,295      instructions              #    1.16  insn per cycle           (38.52%)
    27,984,346,883      branches                  #  977.189 M/sec                    (38.47%)
       566,083,816      branch-misses             #    2.02% of all branches          (38.53%)
    38,976,467,654      L1-dcache-loads           # 1361.024 M/sec                    (38.54%)
     2,509,559,167      L1-dcache-load-misses     #    6.44% of all L1-dcache accesses  (38.55%)
       623,467,709      LLC-loads                 #   21.771 M/sec                    (30.85%)
           275,732      LLC-load-misses           #    0.04% of all LL-cache accesses  (30.88%)
   <not supported>      L1-icache-loads
     3,779,804,730      L1-icache-load-misses                                         (30.90%)
    39,169,897,536      dTLB-loads                # 1367.779 M/sec                    (30.89%)
        25,401,355      dTLB-load-misses          #    0.06% of all dTLB cache accesses  (30.93%)
        44,118,336      iTLB-loads                #    1.541 M/sec                    (30.85%)
        59,421,588      iTLB-load-misses          #  134.69% of all iTLB cache accesses  (30.82%)
   <not supported>      L1-dcache-prefetches
   <not supported>      L1-dcache-prefetch-misses


      32.466371033 seconds time elapsed


       6.262604000 seconds user
      21.943253000 seconds sys
绑定到指定的某一个核心对execl的执行几乎没有影响,执行时间为32.5s,可是设置的执行时间为30s,多出了2.5s?
这2.5s是perl脚本调用可执行程序以及执行perf的时间,在可执行程序中传入的的确是30s,可以通过log文件查看得知,而可执行程序也确实执行30s
主要是用户态与内核态时间总和为28.1s,与运行时间相差1.9s,这1.9s是因挂起等不能在CPU上运行的时间,每一次运行有将近1.9s时间用于睡眠等待
16 CPUs
Benchmark Run: 四 12月 23 2021 14:52:58 - 14:53:31
16 CPUs in system; running 16 parallel copies of tests


Execl Throughput                               8930.6 lps   (29.4 s, 1 samples)


System Benchmarks Partial Index              BASELINE       RESULT    INDEX
Execl Throughput                                 43.0       8930.6   2076.9
                                                                   ========
System Benchmarks Index Score (Partial Only)                         2076.9


 Performance counter stats for './Run execl -c 16 -i 1':


        211,548.28 msec task-clock                #    6.503 CPUs utilized
           161,552      context-switches          #    0.764 K/sec
             5,084      cpu-migrations            #    0.024 K/sec
        14,379,920      page-faults               #    0.068 M/sec
   941,417,141,312      cycles                    #    4.450 GHz                      (30.84%)
   459,158,016,926      instructions              #    0.49  insn per cycle           (38.60%)
    93,913,232,276      branches                  #  443.933 M/sec                    (38.74%)
     1,173,730,464      branch-misses             #    1.25% of all branches          (38.73%)
   130,575,262,392      L1-dcache-loads           #  617.236 M/sec                    (38.61%)
     6,642,658,101      L1-dcache-load-misses     #    5.09% of all L1-dcache accesses  (38.55%)
     1,546,169,660      LLC-loads                 #    7.309 M/sec                    (30.67%)
         1,718,683      LLC-load-misses           #    0.11% of all LL-cache accesses  (30.69%)
   <not supported>      L1-icache-loads
     6,617,437,297      L1-icache-load-misses                                         (30.69%)
   130,265,346,716      dTLB-loads                #  615.771 M/sec                    (30.88%)
        66,280,104      dTLB-load-misses          #    0.05% of all dTLB cache accesses  (30.82%)
        70,596,268      iTLB-loads                #    0.334 M/sec                    (30.83%)
        78,744,118      iTLB-load-misses          #  111.54% of all iTLB cache accesses  (30.96%)
   <not supported>      L1-dcache-prefetches
   <not supported>      L1-dcache-prefetch-misses


      32.532607680 seconds time elapsed


      10.781782000 seconds user
     200.505762000 seconds sys
(30*16-200.78-10.78)/16=16.78s,平均一个CPU没有在CPU上运行的时间为16.78s,主要是因为多核情况下需要考虑多核之间同步、通信以及调度的开销,因此体现在一个CPU上的时间更短,虽然单个CPU的效率降低了,但整体的效率提升了,这也是现在处理器为什么都在追求多核的原因
查看单核运行时count的次数,30s运行了557278次,也就是递归了557278次,如果直接用perf工具去抓取数据会获取到很多不需要的数据,例如前面说的脚本执行、终端为执行程序而进行的fork开销,因此需要更改一下测试程序,以便抓取到的数据更加准确
	/* perf */
 	if (iter == 1000)
	{
		sprintf(cmd, "perf record -F 999 -ag -v -p %d &",getpid());
		system(cmd);
		sleep(1);
	}
	if (iter == 1003)
	{
		sprintf(cmd, "kill $(pidof execl)");
		system(cmd);
	}


	/* ftrace */
    if (iter == 1000)
	{
		char cmd[128] = {0};
		sprintf(cmd, "./trace.sh 1 %d &",getpid());
		system(cmd);
		sleep(1);
	}
	if (iter == 1003)
	{
		char cmd[128] = {0};
		sprintf(cmd, "./trace.sh 2");
		system(cmd);
	}


	sprintf(count_str, "%lu", ++iter); /* increment the execl counter */
	sprintf(start_str, "%lu", (unsigned long) start_time);
	time(&this_time);
测试程序的修改就是在第1000次开启perf,而在第1003次关闭整个程序,只抓取三次的数据,这样不仅数据量小好分析,而且更加准确,添加以上代码保证抓取到的数据是在可执行程序中,ftrace也是一样的原理
perf report输出结果:
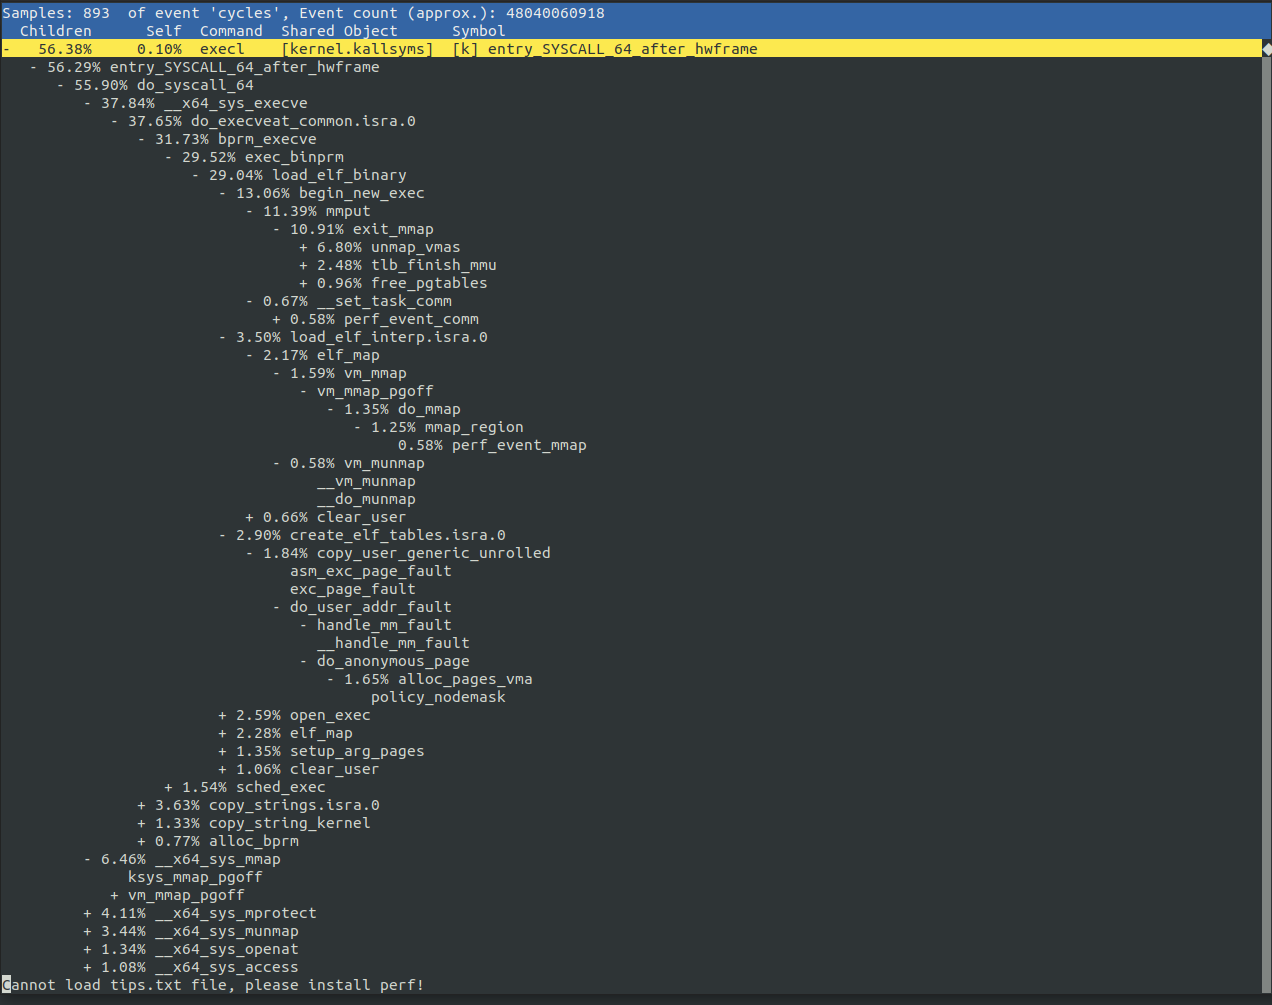
火焰图
绘制火焰图
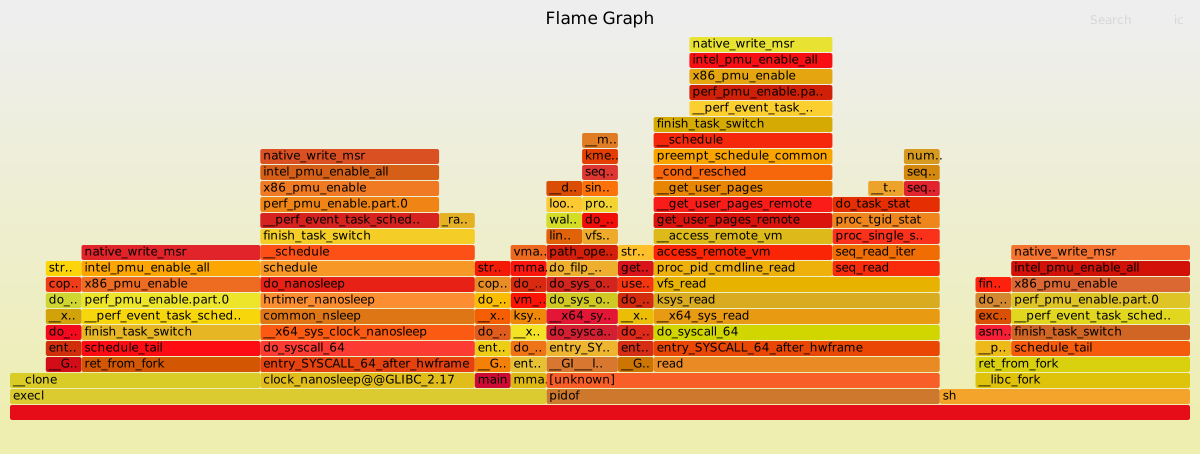
内核态中在CPU上执行主要是execve系统调用,但是执行一个程序需要其他系统调用来分配所需要的资源,例如内存,因此也会在内核态中调用内存相关的接口
火焰图中分成了三大部分,分别是execl、pidof、sh
毫无疑问,execl是测试程序的主进程,测试程序又分为clone、clock_nanosleep、main、mmap四部分
- clock_nanosleep
clock_nanosleep是因为我在测试程序中加入的sleep 1,睡眠1s后产生调度,可是为什么会有perf相关接口执行呢?是因为sleep 1是在perf命令之后运行的,perf命令还没有运行完就被sleep打断进入睡眠,所以sleep完成后又继续执行perf程序,可以看到在finish_task_switch之后上面都是perf操作pmu的接口,前半段是perf执行,后半段冒出一个spin_lock?
是perf在执行前设置pmu状态并读取数据,之后便进入自旋等待测试程序执行完毕,等待完成后再一次读取pmu中的数据并设置pmu状态,对比spin_lock的时间占比和main的时间占比,一模一样
- clone
clone系统调用是因为在测试程序中加入的system(cmd)函数,这个函数将执行cmd字符串中的命令,这里是启动perf,执行perf命令通过clone创建一个perf的进程,可以看到也是先执行execve系统调用,execve是执行命令,当命令执行完时调用clone创建一个新的进程,只是在执行clone时被sleep打断被挂起,sleep执行完后clone继续执行,所以这里被截成了两段,还有就是clone执行的时间本应该很短,这里却执行了和sleep差不多的时间,也说明了clone被sleep打断,导致clone后半段执行的时间是前面的几倍
- main
main是execl测试程序的主要部分,就负责执行execve,就像工地上搬砖的工人,只负责干活,其他事一概不管,而perf是包工头,负责监督main是否执行完,执行完则向上级汇报
- mmap
mmap是因为execl每一次调用都会将可执行文件重新映射到到当前的进程上下文中,execl每次都会重新映射可执行文件而不是创建新的子进程,因此需要调用mmap重新将execl文件映射到当前进程的虚拟内存空间中
pidof是因为在程序执行中用pidof程序去获取execl进程的pid,分为三部分
- readlink
readlink是获取pidof二进制文件的绝对路径,为后面的open做准备,只有获取到pidof文件的路径才能将其作为参数传入
- open
open拿到上面的文件路径,首先根据路径查找到文件,如果文件不存在则报错,进而调用vfs_open,将进程相关的字符串作为参数传递进去,打开目录、打开文件,准备执行pidof,分配内存,这时文件系统中已经有对应的文件句柄,可以通过文件句柄获取到pidof文件,执行完后将pid值返回
- read
pidof主要功能就是读取进程的pid值,只需要调用read即可,read根据传进来的字符串在proc文件系统中循环查找匹配的进程,如果匹配到进程则通过proc中的参数把获取到的pid值转化成字符串返回
perf通过-p $(pidof execl)参数将pidof返回的字符串作为一个参数传递给perf,调度之后便开始执行perf
sh为终端调用部分
终端为execl测试程序创建子进程,只是这里并没有采集到终端为execl测试程序创建子进程,因为这个过程早在测试开始时就已经完成,这里是为perf程序创建子进程,通过调用system去执行启动perf的命令,就像在终端中执行perf命令,最终调用fork创建perf进程
offcpu火焰图
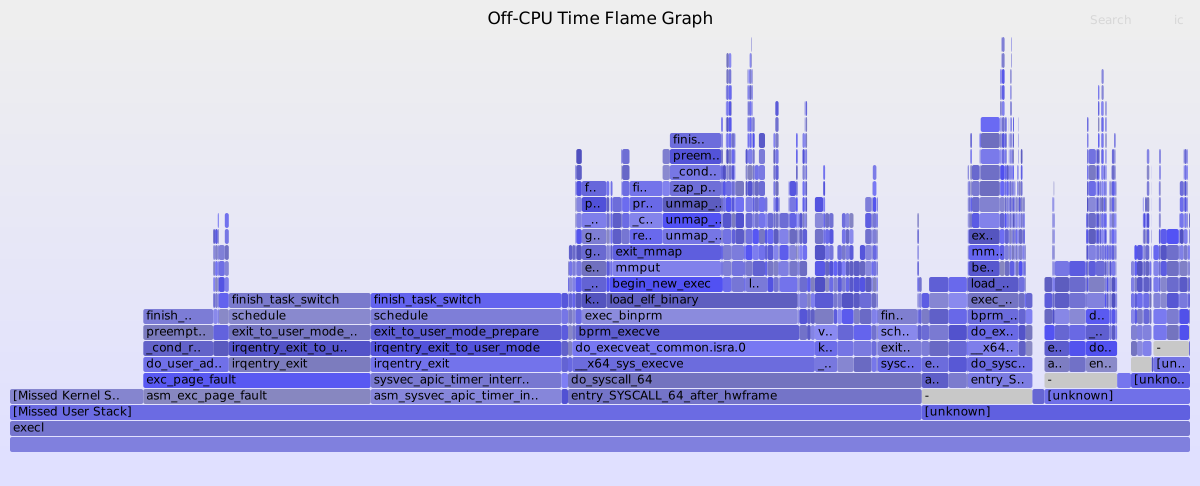
结合上面分析,off cpu time有4s多
ftrace
ftrace数据
 trace_execl.txt
 从ftrace的数据中可以看出来execve系统调用确实执行了三次,每一次执行execve还会涉及到其他的系统调用,例如__x64_sys_access、__x64_sys_mmap等,执行execve系统调用后会产生多次缺页异常,因为需要为新的程序在当前的进程上下文中开辟空间,而之前运行的程序会被当前新的程序覆盖,最主要的流程是由execve系统调用完成的
核心流程:
open
static long do_sys_openat2(int dfd, const char __user *filename,
			   struct open_how *how)
{
	struct open_flags op;
	int fd = build_open_flags(how, &op);//...1
	struct filename *tmp;


	tmp = getname(filename);//...2


	fd = get_unused_fd_flags(how->flags);//...3
	if (fd >= 0) {
		struct file *f = do_filp_open(dfd, tmp, &op);//...4
		if (IS_ERR(f)) {
			put_unused_fd(fd);
			fd = PTR_ERR(f);
		} else {
			fsnotify_open(f);
			fd_install(fd, f);//...5
		}
	}
	putname(tmp);
	return fd;
}
1:主要是设置open_flags结构体,根据用户层的flag设置op结构
2:在kernel中为用户层传入的filename通过slac分配通用内存,并将用户层的filename拷贝到刚分配的缓存中
3:在当前进程中的fd数组中查找一个未使用的fd,
4:设置当前进程的nameidata,建立filename与dentry之间的关系,在slab的filp_cachep缓存中为file结构分配内存,将上面分配的fd与file关联起来,通过解析filename找到vfsmount与对应的dentry
5:更新当前进程的file_struct
newfstat
SYSCALL_DEFINE2(newfstat, unsigned int, fd, struct stat __user *, statbuf)
{
	struct kstat stat;
	int error = vfs_fstat(fd, &stat);//...1


	if (!error)
		error = cp_new_stat(&stat, statbuf);//...2


	return error;
}
1:通过open操作已经更新了当前进程的file_struct,这里将用户态的fd转化成内核态的fd,fd与当前进程的file已经关联起来,通过fd获取到file,再通过file获取到文件的inode,进而得到inode的ops,调用其接口将inode中的文件信息复制到stat缓冲区中
2:将stat缓冲区中的数据复制到tmp缓冲区并发送到用户态
mmap
unsigned long ksys_mmap_pgoff(unsigned long addr, unsigned long len,
			      unsigned long prot, unsigned long flags,
			      unsigned long fd, unsigned long pgoff)
{
	struct file *file = NULL;
	unsigned long retval;


	if (!(flags & MAP_ANONYMOUS)) {
		audit_mmap_fd(fd, flags);//...1
		file = fget(fd);
		if (!file)
			return -EBADF;
		retval = -EINVAL;
	} else if (flags & MAP_HUGETLB) {
		hs = hstate_sizelog(page_size_log);//...2


		file = hugetlb_file_setup(HUGETLB_ANON_FILE, len,//...3
				VM_NORESERVE,
				&user, HUGETLB_ANONHUGE_INODE, page_size_log);
	}


	retval = vm_mmap_pgoff(file, addr, len, prot, flags, pgoff);//...4
out_fput:
	if (file)
		fput(file);
	return retval;
}
1:匿名映射不关联任何文件,只需要为fd加上匿名映射标志
2:获取huge_page size大小以及状态信息
3:根据上面获取的huge_page大小将这些page挂载到指定的vfsmount,将file_region用list连接到一起,resv_map作为链表头,将其关联到当前进程的vma中,并为file_region代表的文件区域分配内存,建立映射
4.1:首先在当前进程的vma中找一块没有使用的区域,查找分为两种情况,一是在指定了addr参数的情况下,则会根据addr参数调用find_vma通过rb_tree遍历所有的vma,直到找到一个符合的vma,二是没有指定addr参数,这样需要调用vm_unmapped_area在虚拟地址空间中找到一片符合的区域,查找方法为通过rb_tree找到每一个vma的gap_end位置,再找到下一个vma的gap_start位置,计算是否符合大小,如果符合大小则返回这片区域的起始位置
4.2:在mmap_region中对上面的区域再次检查,如果需要扩充且扩充区域有其他vma映射则取消其他映射,判断是否有相似的vma映射可以直接通过扩充即可完成,如果没有的话则需要分配一个新的vma结构表示这片新的区域,后面的操作就是将这个新的vma填充数据并插入到链表和rb_tree中
pread64
ssize_t ksys_pread64(unsigned int fd, char __user *buf, size_t count,
		     loff_t pos)
{
	f = fdget(fd);//...1
	if (f.file) {
		ret = -ESPIPE;
		if (f.file->f_mode & FMODE_PREAD)
			ret = vfs_read(f.file, buf, count, &pos);//...2
		fdput(f);
	}


	return ret;
}
1:从当前进程file_struct中的fdtable中找一个未使用的fd,关联到file结构,然后将file结构转化成fd,fd给用户态使用,在内核态中则是使用file
2:先验证标志,之后调用不同的read接口,这里是同步读,并且使用迭代器,从file的kiocb中计算出区块数量以及各个区块起始结束位置,在这些映射的区域查找page,检查是否已经在缓存过,没有缓存再使用预读,如果需要重新读取则通过遍历radix树找到需要的page,分配内存,通过rcu机制将page内容复制到缓存的page中
close7
int __close_fd(struct files_struct *files, unsigned fd)
{
	struct file *file;
	struct fdtable *fdt;


	spin_lock(&files->file_lock);
	fdt = files_fdtable(files);//...1
	file = fdt->fd[fd];
	rcu_assign_pointer(fdt->fd[fd], NULL);
	__put_unused_fd(files, fd);
	spin_unlock(&files->file_lock);
	return filp_close(file, files);//...2


out_unlock:
	spin_unlock(&files->file_lock);
	return -EBADF;
}
1:从fdtable中获取当前使用的fd
2:减少file的计数,释放申请的内存
fstime
perf stat
ONE CPU
256 bufsize 500 maxblocks(fsbuffer)
Benchmark Run: 四 12月 23 2021 14:38:47 - 14:39:35
16 CPUs in system; running 1 parallel copy of tests


File Copy 256 bufsize 500 maxblocks          423736.0 KBps  (30.0 s, 1 samples)


System Benchmarks Partial Index              BASELINE       RESULT    INDEX
File Copy 256 bufsize 500 maxblocks            1655.0     423736.0   2560.3
                                                                   ========
System Benchmarks Index Score (Partial Only)                         2560.3


 Performance counter stats for './Run fsbuffer -c 1 -i 1':


         34,082.86 msec task-clock                #    0.707 CPUs utilized
             3,134      context-switches          #    0.092 K/sec
                15      cpu-migrations            #    0.000 K/sec
             8,842      page-faults               #    0.259 K/sec
   155,940,105,364      cycles                    #    4.575 GHz                      (30.77%)
   266,557,800,817      instructions              #    1.71  insn per cycle           (38.48%)
    51,350,048,196      branches                  # 1506.624 M/sec                    (38.47%)
       257,398,013      branch-misses             #    0.50% of all branches          (38.49%)
    82,692,522,120      L1-dcache-loads           # 2426.220 M/sec                    (38.49%)
       599,243,218      L1-dcache-load-misses     #    0.72% of all L1-dcache accesses  (38.49%)
        52,135,572      LLC-loads                 #    1.530 M/sec                    (30.82%)
            87,004      LLC-load-misses           #    0.17% of all LL-cache accesses  (30.82%)
   <not supported>      L1-icache-loads
     5,017,951,037      L1-icache-load-misses                                         (30.83%)
    82,524,838,305      dTLB-loads                # 2421.300 M/sec                    (30.86%)
           132,759      dTLB-load-misses          #    0.00% of all dTLB cache accesses  (30.82%)
           128,873      iTLB-loads                #    0.004 M/sec                    (30.81%)
       253,821,378      iTLB-load-misses          # 196954.66% of all iTLB cache accesses  (30.82%)
   <not supported>      L1-dcache-prefetches
   <not supported>      L1-dcache-prefetch-misses


      48.228805657 seconds time elapsed


       3.263622000 seconds user
      30.825572000 seconds sys
1024 bufsize 2000 maxblocks(fstime)
Benchmark Run: 四 12月 23 2021 14:41:07 - 14:41:55
16 CPUs in system; running 1 parallel copy of tests


File Copy 1024 bufsize 2000 maxblocks       1584363.0 KBps  (30.0 s, 1 samples)


System Benchmarks Partial Index              BASELINE       RESULT    INDEX
File Copy 1024 bufsize 2000 maxblocks          3960.0    1584363.0   4000.9
                                                                   ========
System Benchmarks Index Score (Partial Only)                         4000.9


 Performance counter stats for './Run fstime -c 1 -i 1':


         34,077.27 msec task-clock                #    0.706 CPUs utilized
             3,252      context-switches          #    0.095 K/sec
               239      cpu-migrations            #    0.007 K/sec
             8,896      page-faults               #    0.261 K/sec
   153,840,956,663      cycles                    #    4.514 GHz                      (30.77%)
   249,604,080,542      instructions              #    1.62  insn per cycle           (38.47%)
    48,052,471,061      branches                  # 1410.103 M/sec                    (38.48%)
       236,631,139      branch-misses             #    0.49% of all branches          (38.49%)
    77,352,354,332      L1-dcache-loads           # 2269.910 M/sec                    (38.50%)
     1,914,720,560      L1-dcache-load-misses     #    2.48% of all L1-dcache accesses  (38.54%)
       541,853,060      LLC-loads                 #   15.901 M/sec                    (30.85%)
         5,407,900      LLC-load-misses           #    1.00% of all LL-cache accesses  (30.88%)
   <not supported>      L1-icache-loads
     4,408,850,571      L1-icache-load-misses                                         (30.88%)
    77,371,436,027      dTLB-loads                # 2270.470 M/sec                    (30.81%)
           716,982      dTLB-load-misses          #    0.00% of all dTLB cache accesses  (30.79%)
            69,341      iTLB-loads                #    0.002 M/sec                    (30.76%)
       270,235,450      iTLB-load-misses          # 389719.57% of all iTLB cache accesses  (30.76%)
   <not supported>      L1-dcache-prefetches
   <not supported>      L1-dcache-prefetch-misses


      48.235344995 seconds time elapsed


       3.055368000 seconds user
      31.029949000 seconds sys
4096 bufsize 8000 maxblocks(fsdisk)
Benchmark Run: 四 12月 23 2021 14:42:25 - 14:43:13
16 CPUs in system; running 1 parallel copy of tests


File Copy 4096 bufsize 8000 maxblocks       4243414.0 KBps  (30.0 s, 1 samples)


System Benchmarks Partial Index              BASELINE       RESULT    INDEX
File Copy 4096 bufsize 8000 maxblocks          5800.0    4243414.0   7316.2
                                                                   ========
System Benchmarks Index Score (Partial Only)                         7316.2


 Performance counter stats for './Run fsdisk -c 1 -i 1':


         34,053.42 msec task-clock                #    0.705 CPUs utilized
             3,313      context-switches          #    0.097 K/sec
               396      cpu-migrations            #    0.012 K/sec
             8,790      page-faults               #    0.258 K/sec
   152,019,701,976      cycles                    #    4.464 GHz                      (30.82%)
   170,328,549,898      instructions              #    1.12  insn per cycle           (38.52%)
    32,811,407,819      branches                  #  963.528 M/sec                    (38.52%)
       169,784,950      branch-misses             #    0.52% of all branches          (38.50%)
    52,562,514,590      L1-dcache-loads           # 1543.531 M/sec                    (38.50%)
     5,389,798,624      L1-dcache-load-misses     #   10.25% of all L1-dcache accesses  (38.51%)
     2,016,780,739      LLC-loads                 #   59.224 M/sec                    (30.81%)
       504,797,542      LLC-load-misses           #   25.03% of all LL-cache accesses  (30.80%)
   <not supported>      L1-icache-loads
     2,856,075,679      L1-icache-load-misses                                         (30.80%)
    52,811,874,427      dTLB-loads                # 1550.854 M/sec                    (30.79%)
        29,117,727      dTLB-load-misses          #    0.06% of all dTLB cache accesses  (30.79%)
           132,781      iTLB-loads                #    0.004 M/sec                    (30.81%)
       162,215,002      iTLB-load-misses          # 122167.33% of all iTLB cache accesses  (30.83%)
   <not supported>      L1-dcache-prefetches
   <not supported>      L1-dcache-prefetch-misses


      48.315056880 seconds time elapsed


       2.062300000 seconds user
      31.998973000 seconds sys
16 CPUs
256 bufsize 500 maxblocks(fsbuffer)
Benchmark Run: 四 12月 23 2021 14:44:56 - 14:45:45
16 CPUs in system; running 16 parallel copies of tests


File Copy 256 bufsize 500 maxblocks          315629.0 KBps  (30.0 s, 1 samples)


System Benchmarks Partial Index              BASELINE       RESULT    INDEX
File Copy 256 bufsize 500 maxblocks            1655.0     315629.0   1907.1
                                                                   ========
System Benchmarks Index Score (Partial Only)                         1907.1


 Performance counter stats for './Run fsbuffer -c 16 -i 1':


        271,783.38 msec task-clock                #    5.625 CPUs utilized
         4,956,021      context-switches          #    0.018 M/sec
            12,132      cpu-migrations            #    0.045 K/sec
            18,412      page-faults               #    0.068 K/sec
   991,163,617,922      cycles                    #    3.647 GHz                      (30.70%)
   444,310,503,585      instructions              #    0.45  insn per cycle           (38.41%)
    87,276,301,214      branches                  #  321.124 M/sec                    (38.42%)
       535,284,018      branch-misses             #    0.61% of all branches          (38.49%)
   132,223,081,566      L1-dcache-loads           #  486.502 M/sec                    (38.50%)
     4,035,888,213      L1-dcache-load-misses     #    3.05% of all L1-dcache accesses  (38.52%)
     1,084,613,415      LLC-loads                 #    3.991 M/sec                    (30.81%)
           861,683      LLC-load-misses           #    0.08% of all LL-cache accesses  (30.83%)
   <not supported>      L1-icache-loads
     7,055,494,943      L1-icache-load-misses                                         (30.80%)
   132,277,027,755      dTLB-loads                #  486.700 M/sec                    (30.84%)
         6,932,986      dTLB-load-misses          #    0.01% of all dTLB cache accesses  (30.84%)
        21,525,479      iTLB-loads                #    0.079 M/sec                    (30.75%)
       401,433,806      iTLB-load-misses          # 1864.92% of all iTLB cache accesses  (30.77%)
   <not supported>      L1-dcache-prefetches
   <not supported>      L1-dcache-prefetch-misses


      48.320787244 seconds time elapsed


       7.335821000 seconds user
     274.847285000 seconds sys
1024 bufsize 2000 maxblocks(fstime)
Benchmark Run: 四 12月 23 2021 14:46:43 - 14:47:32
16 CPUs in system; running 16 parallel copies of tests


File Copy 1024 bufsize 2000 maxblocks       1206101.0 KBps  (30.0 s, 1 samples)


System Benchmarks Partial Index              BASELINE       RESULT    INDEX
File Copy 1024 bufsize 2000 maxblocks          3960.0    1206101.0   3045.7
                                                                   ========
System Benchmarks Index Score (Partial Only)                         3045.7


 Performance counter stats for './Run fstime -c 16 -i 1':


        273,436.44 msec task-clock                #    5.654 CPUs utilized
         4,987,119      context-switches          #    0.018 M/sec
             8,473      cpu-migrations            #    0.031 K/sec
            18,040      page-faults               #    0.066 K/sec
   990,912,051,893      cycles                    #    3.624 GHz                      (30.81%)
   431,816,853,002      instructions              #    0.44  insn per cycle           (38.54%)
    84,910,951,584      branches                  #  310.533 M/sec                    (38.54%)
       515,753,028      branch-misses             #    0.61% of all branches          (38.50%)
   128,205,016,105      L1-dcache-loads           #  468.866 M/sec                    (38.51%)
     6,234,415,560      L1-dcache-load-misses     #    4.86% of all L1-dcache accesses  (38.49%)
     1,897,451,914      LLC-loads                 #    6.939 M/sec                    (30.78%)
         1,587,539      LLC-load-misses           #    0.08% of all LL-cache accesses  (30.84%)
   <not supported>      L1-icache-loads
     6,771,468,771      L1-icache-load-misses                                         (30.78%)
   128,547,600,250      dTLB-loads                #  470.119 M/sec                    (30.77%)
        16,334,069      dTLB-load-misses          #    0.01% of all dTLB cache accesses  (30.75%)
        16,100,353      iTLB-loads                #    0.059 M/sec                    (30.74%)
       400,456,205      iTLB-load-misses          # 2487.25% of all iTLB cache accesses  (30.79%)
   <not supported>      L1-dcache-prefetches
   <not supported>      L1-dcache-prefetch-misses


      48.360981517 seconds time elapsed


       7.526683000 seconds user
     276.405550000 seconds sys
4096 bufsize 8000 maxblocks(fsdisk)
Benchmark Run: 四 12月 23 2021 14:48:31 - 14:49:20
16 CPUs in system; running 16 parallel copies of tests


File Copy 4096 bufsize 8000 maxblocks       4195324.0 KBps  (30.0 s, 1 samples)


System Benchmarks Partial Index              BASELINE       RESULT    INDEX
File Copy 4096 bufsize 8000 maxblocks          5800.0    4195324.0   7233.3
                                                                   ========
System Benchmarks Index Score (Partial Only)                         7233.3


 Performance counter stats for './Run fsdisk -c 16 -i 1':


        283,669.32 msec task-clock                #    5.864 CPUs utilized
         5,051,802      context-switches          #    0.018 M/sec
             8,954      cpu-migrations            #    0.032 K/sec
            18,132      page-faults               #    0.064 K/sec
 1,073,977,307,291      cycles                    #    3.786 GHz                      (30.78%)
   377,343,252,849      instructions              #    0.35  insn per cycle           (38.48%)
    74,535,589,976      branches                  #  262.755 M/sec                    (38.47%)
       454,005,279      branch-misses             #    0.61% of all branches          (38.49%)
   111,237,810,351      L1-dcache-loads           #  392.139 M/sec                    (38.45%)
    15,267,402,108      L1-dcache-load-misses     #   13.73% of all L1-dcache accesses  (38.48%)
     4,660,034,586      LLC-loads                 #   16.428 M/sec                    (30.78%)
       349,915,677      LLC-load-misses           #    7.51% of all LL-cache accesses  (30.80%)
   <not supported>      L1-icache-loads
     6,099,871,413      L1-icache-load-misses                                         (30.86%)
   111,234,178,811      dTLB-loads                #  392.126 M/sec                    (30.81%)
       103,090,927      dTLB-load-misses          #    0.09% of all dTLB cache accesses  (30.82%)
         8,264,246      iTLB-loads                #    0.029 M/sec                    (30.79%)
       306,590,884      iTLB-load-misses          # 3709.85% of all iTLB cache accesses  (30.76%)
   <not supported>      L1-dcache-prefetches
   <not supported>      L1-dcache-prefetch-misses


      48.374793002 seconds time elapsed


       6.256268000 seconds user
     287.635970000 seconds sys
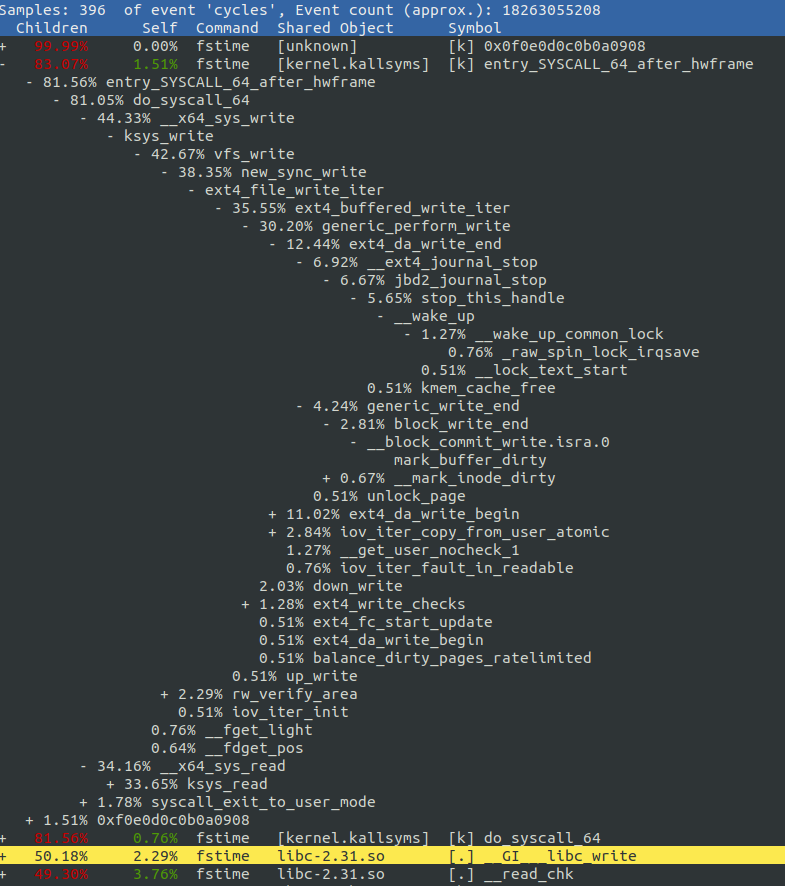
用perf粗略查看一下调用关系
火焰图
绘制火焰图
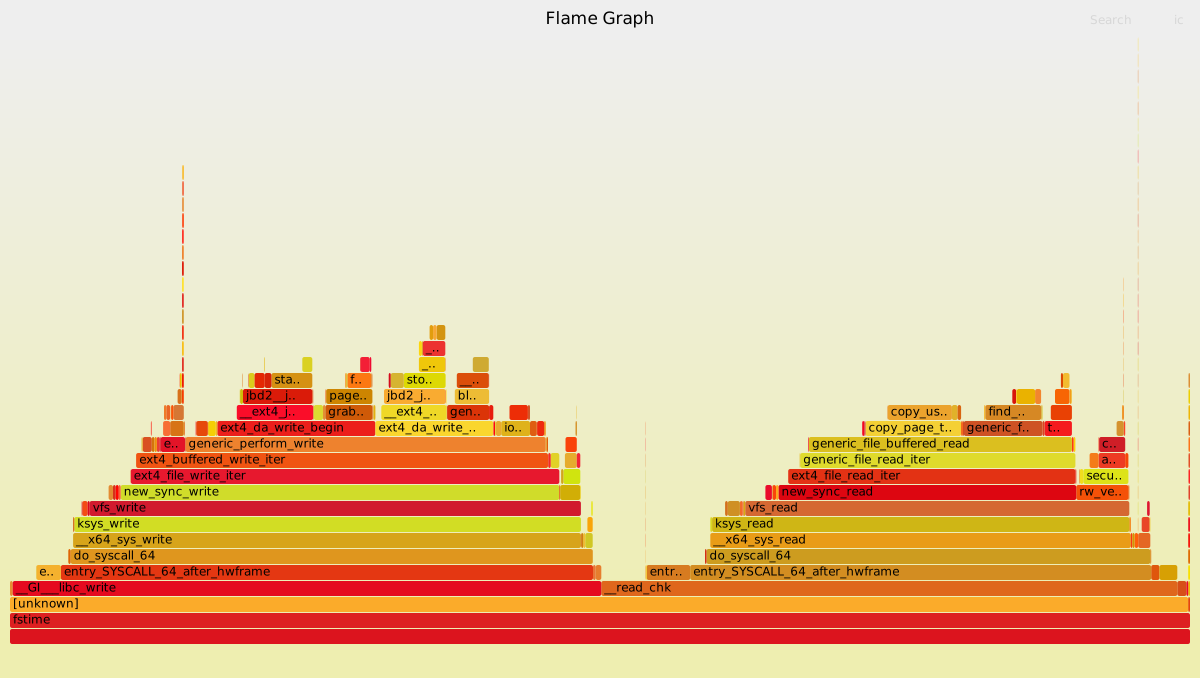
file copy测试包含三部分:fsbuffer、fstime、fsdisk,三者只是参数不同,执行过程都一样,与execl不同,file copy抓取数据没有更改测试代码,因为是在执行过程中抓取的,w_test、r_test几乎没有抓到,sh也只是一小部分,fstime测试是从一个文件中读取数据到buffer中,然后把buffer中的数据写入到另一个文件,可以看到火焰图上95%以上都在进行读写
- read
read主要是调用ext4文件系统的read函数,先是调用vfs层的read函数进入ext4的read,进而通过iter函数将数据从文件中读取到buffer中
- write
write与read的原理类似,也是通过vfs层的接口进入到ext4的write函数,调用带buffer的写将buffer中的数据写入到文件中
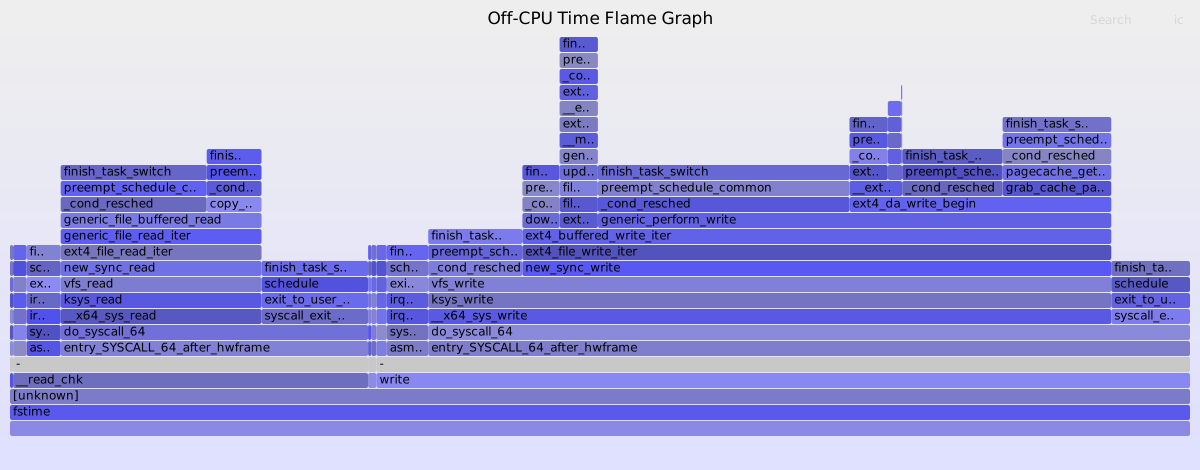
offcpu火焰图
ftrace
ftrace数据
核心流程:
read:
ssize_t ksys_read(unsigned int fd, char __user *buf, size_t count)
{
	struct fd f = fdget_pos(fd);
	if (f.file) {
		loff_t pos = file_pos_read(f.file);//...1
		ret = vfs_read(f.file, buf, count, &pos);
		if (ret >= 0)
			file_pos_write(f.file, pos);
		fdput_pos(f);
	}
	return ret;
}
1:read与pread64不同的是pos参数是直接传递的,不用自动获取,默认从头开始,需要使用seek系统调用才能改变fd指针的位置
write:
ssize_t ksys_write(unsigned int fd, const char __user *buf, size_t count)
{
	struct fd f = fdget_pos(fd);
	if (f.file) {
		loff_t pos = file_pos_read(f.file);
		ret = vfs_write(f.file, buf, count, &pos);//...1
		if (ret >= 0)
			file_pos_write(f.file, pos);
		fdput_pos(f);
	}


	return ret;
}
1:写与读几乎没什么差别,调用格式也差不多,写的过程也是先找到涉及的区块,标记需要写的page为dirty,待后续文件系统进行同步时将dirty page写到磁盘上
spawn
perf stat
perf stat计算总体执行时间
ONE CPU
Benchmark Run: 四 12月 23 2021 15:05:19 - 15:05:52
16 CPUs in system; running 1 parallel copy of tests


Process Creation                               5337.9 lps   (30.0 s, 1 samples)


System Benchmarks Partial Index              BASELINE       RESULT    INDEX
Process Creation                                126.0       5337.9    423.6
                                                                   ========
System Benchmarks Index Score (Partial Only)                          423.6


 Performance counter stats for './Run spawn -c 1 -i 1':


         26,167.07 msec task-clock                #    0.789 CPUs utilized
           161,985      context-switches          #    0.006 M/sec
               484      cpu-migrations            #    0.018 K/sec
         3,212,277      page-faults               #    0.123 M/sec
    31,924,706,495      cycles                    #    1.220 GHz                      (47.01%)
    33,559,073,647      instructions              #    1.05  insn per cycle           (55.68%)
     6,427,607,548      branches                  #  245.637 M/sec                    (57.12%)
        35,638,234      branch-misses             #    0.55% of all branches          (57.57%)
     9,501,119,244      L1-dcache-loads           #  363.094 M/sec                    (56.06%)
     1,004,076,496      L1-dcache-load-misses     #   10.57% of all L1-dcache accesses  (56.12%)
       202,209,507      LLC-loads                 #    7.728 M/sec                    (46.63%)
         1,277,611      LLC-load-misses           #    0.63% of all LL-cache accesses  (47.04%)
   <not supported>      L1-icache-loads
       562,425,379      L1-icache-load-misses                                         (47.95%)
     8,991,531,008      dTLB-loads                #  343.620 M/sec                    (48.18%)
        10,054,364      dTLB-load-misses          #    0.11% of all dTLB cache accesses  (47.41%)
        13,219,311      iTLB-loads                #    0.505 M/sec                    (46.91%)
        13,557,490      iTLB-load-misses          #  102.56% of all iTLB cache accesses  (47.41%)
   <not supported>      L1-dcache-prefetches
   <not supported>      L1-dcache-prefetch-misses


      33.147949504 seconds time elapsed


      16.601526000 seconds user
      13.412330000 seconds sys
16 CPUs
Benchmark Run: 四 12月 23 2021 15:06:18 - 15:06:51
16 CPUs in system; running 16 parallel copies of tests


Process Creation                              16079.3 lps   (30.0 s, 1 samples)


System Benchmarks Partial Index              BASELINE       RESULT    INDEX
Process Creation                                126.0      16079.3   1276.1
                                                                   ========
System Benchmarks Index Score (Partial Only)                         1276.1


 Performance counter stats for './Run spawn -c 16 -i 1':


        213,006.80 msec task-clock                #    6.424 CPUs utilized
           670,903      context-switches          #    0.003 M/sec
           219,220      cpu-migrations            #    0.001 M/sec
         9,937,918      page-faults               #    0.047 M/sec
   575,735,408,486      cycles                    #    2.703 GHz                      (42.56%)
   272,535,860,372      instructions              #    0.47  insn per cycle           (51.51%)
    55,880,538,531      branches                  #  262.342 M/sec                    (50.59%)
       370,695,412      branch-misses             #    0.66% of all branches          (50.82%)
    80,642,180,315      L1-dcache-loads           #  378.590 M/sec                    (50.82%)
     5,171,544,221      L1-dcache-load-misses     #    6.41% of all L1-dcache accesses  (50.70%)
     1,267,080,286      LLC-loads                 #    5.949 M/sec                    (42.00%)
        29,153,297      LLC-load-misses           #    2.30% of all LL-cache accesses  (42.40%)
   <not supported>      L1-icache-loads
     3,413,160,081      L1-icache-load-misses                                         (42.58%)
    77,481,372,287      dTLB-loads                #  363.751 M/sec                    (42.11%)
        65,905,927      dTLB-load-misses          #    0.09% of all dTLB cache accesses  (42.28%)
        52,469,825      iTLB-loads                #    0.246 M/sec                    (42.38%)
        49,571,180      iTLB-load-misses          #   94.48% of all iTLB cache accesses  (42.33%)
   <not supported>      L1-dcache-prefetches
   <not supported>      L1-dcache-prefetch-misses


      33.159828536 seconds time elapsed


      56.299737000 seconds user
     168.430581000 seconds sys
为了使抓取到的数据更准确,需要更改一下测试程序
		if (iter == 1000)
		{
			char cmd[128] = {0};
			sprintf(cmd, "./trace.sh 1 %d &",getpid());
			system(cmd);
			sleep(1);
		}
		if (iter == 1003)
		{
			char cmd[128] = {0};
			sprintf(cmd, "./trace.sh 2");
			system(cmd);
		}
同样在第1000次开启,在第1003次关闭
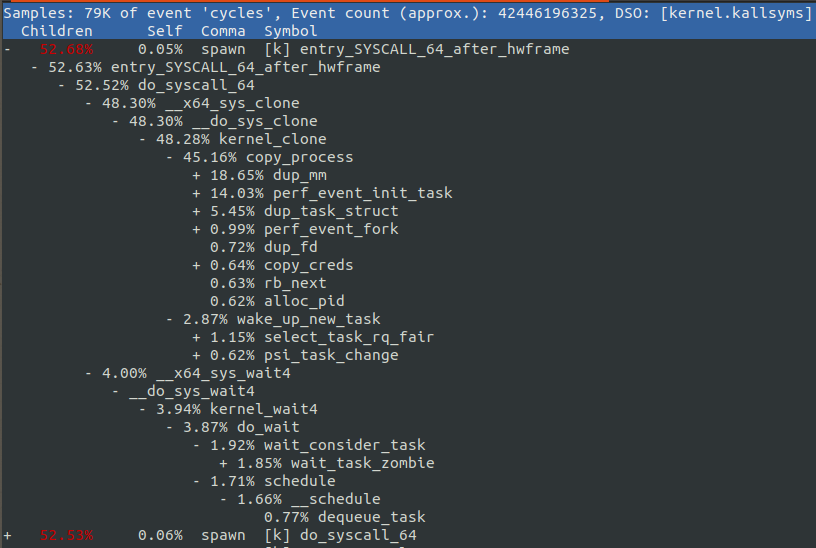
perf总体显示调用关系:
火焰图
火焰
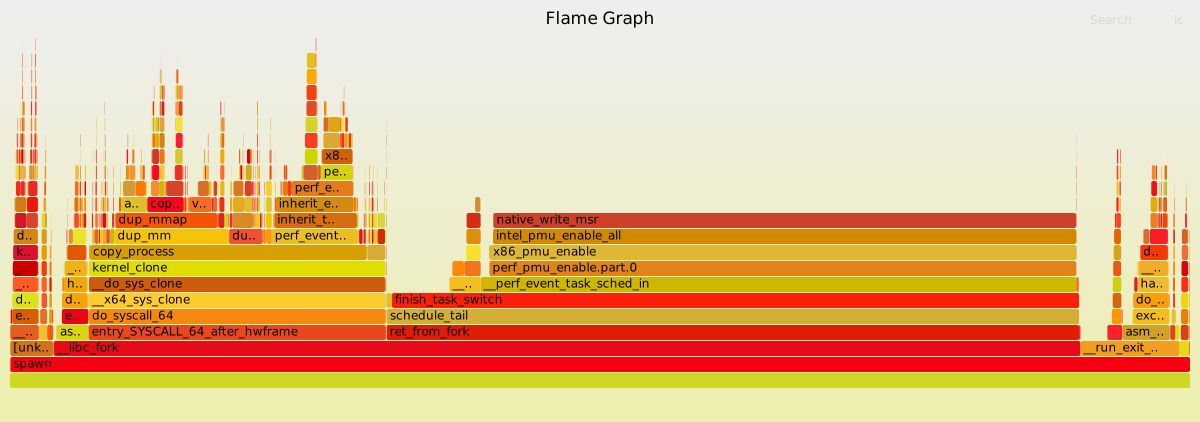
spawn的执行流程是进入main函数后在死循环中不停fork创建子进程,但并没有执行,在火焰图中主要有unknow、libc_fork、__run_exit_handlers
unknow是main函数执行以及wait等待函数的执行
__run_exit_handlers是释放page
libc_fork一是主要的fork函数执行,二是perf函数的fork执行部分,可以看到除了ret_from_fork,其他都是fork的调用栈,ret_from_fork的时间占比怎么这么高?主要是因为执行时间太短,只采集了三次fork,如果等测试执行完,时间变长以后,ret_from_fork几乎看不到占比
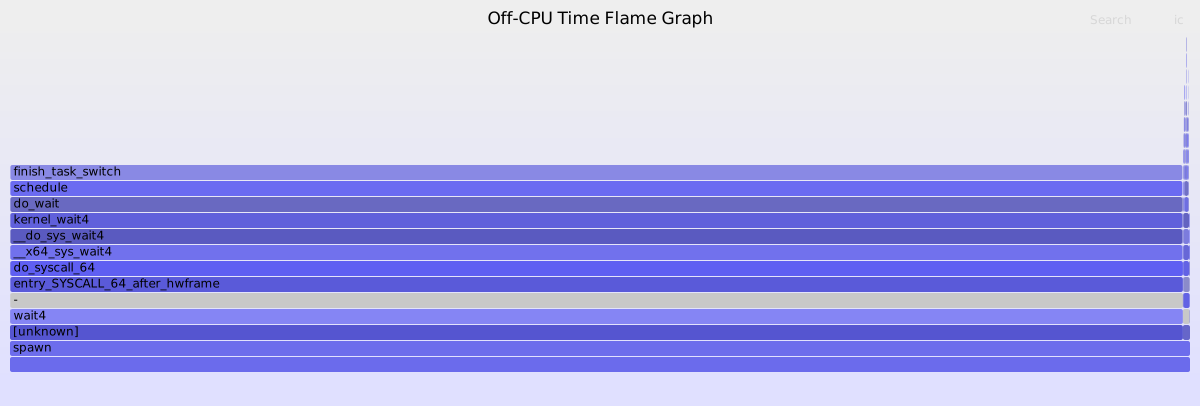
offcpu火焰图
ftrace
ftrace数据
核心流程:
clone:
long _do_fork(unsigned long clone_flags,
	      unsigned long stack_start,
	      unsigned long stack_size,
	      int __user *parent_tidptr,
	      int __user *child_tidptr,
	      unsigned long tls)
{
	p = copy_process(clone_flags, stack_start, stack_size,
			 child_tidptr, NULL, trace, tls, NUMA_NO_NODE);//...1
	add_latent_entropy();//...2


	pid = get_task_pid(p, PIDTYPE_PID);//...3
	nr = pid_vnr(pid);


	if (clone_flags & CLONE_PARENT_SETTID)
		put_user(nr, parent_tidptr);


	if (clone_flags & CLONE_VFORK) {
		p->vfork_done = &vfork;
		init_completion(&vfork);
		get_task_struct(p);//...4
	}


	wake_up_new_task(p);//...5


	put_pid(pid);
}
1:为新的task_struct分配内存,分配的是虚拟地址的vma,并初始化数据
2:为新进程创建随机熵用于调度
3:获取新进程的pid
4:vfork会共享vma,因此会使用completion进行同步,减少usage计数说明可以继续执行,等待完成
5:将新进程添加到可运行队列中
wait4:
long kernel_wait4(pid_t upid, int __user *stat_addr, int options,
		  struct rusage *ru)
{
	if (upid == -1)
		type = PIDTYPE_MAX;
	else if (upid < 0
		type = PIDTYPE_PGID;
		pid = find_get_pid(-upid);
	} else if (upid == 0) {
		type = PIDTYPE_PGID;
		pid = get_task_pid(current, PIDTYPE_PGID);
	} else /* upid > 0 */ {
		type = PIDTYPE_PID;
		pid = find_get_pid(upid);
	}


	ret = do_wait(&wo);//...1
	put_pid(pid);
}
1:将任务添加到等待队列,等待创建完成进行唤醒,唤醒则会调用调度器的接口